Your charts were the best and I always found them very useful on all my flights.


Built by pilots, PlanningCharts transforms complex aviation data into one intuitive, interactive flight planning experience.

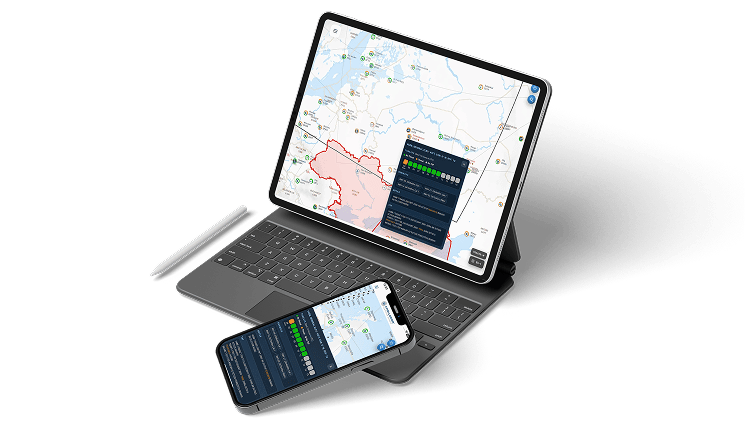
PlanningCharts began in the early 1990s as handwritten briefing charts created by German Check Captain Gerd Puppel to simplify complex long-haul operations. Over the years, those cockpit notes evolved into a professional digital platform trusted by pilots worldwide.
Today, under Apollodor Aviation, PlanningCharts combines decades of operational expertise with official Lido Sky Data from Lufthansa Systems, delivering a modern flight planning experience built for today's aviation professionals.
We transform trusted aviation data into clear, visual intelligence that enhances situational awareness and helps pilots make faster, more informed decisions before and during every flight.

We envision a world where every pilot has instant access to reliable operational information through one intuitive platform—raising the standard for modern flight planning worldwide.

Born from real cockpit needs, our charts carry decades of pilot experience and operational insight.

From patented symbology to daily NAT track integration, we’re committed to constant improvement.
Now powered by Lido Sky Data, our charts incorporate EASA-certified information and industry standards.

With AIRAC cycle updates, real-time weather, and NOTAMs, every threat is visible at a glance.


Uli Schultz is an active Captain on A350 with a professional experience of more than 25 years.
He is the Managing Director of APOLLODOR Aviation GmbH which was founded to continue work and development on PLANNINGCHARTS in order to make our daily pilots life a little bit easier.

Oliver Bohland is a management consultant and IT architect.
He developed the backend as well as the data-repository, apis and user-management.

Oliver Matz is an active pilot on B787 with more than 20 years of professional experience.
As an IT-specialist with enormous aviation background regarding charting and EFB applications, he developed the backend for the chart generation including automatic data import from LIDO, NOTAMs, etc.

Frederik Schultz brings his passion for aviation to every task, supporting the team with expert data analysis and attentive customer support.
His commitment ensures both accuracy in our charts and satisfaction in every client interaction.

Marc Roset leads the Vitec team behind the digital development of PlanningCharts.
From product design to product development, Marc ensures that the charts can be visualized and used on a solid, user-friendly basis. Responsible also for the website and app design.

The roots of PlanningCharts go back to the early 1990s, when a German check captain began creating handwritten regional briefing charts to help guide inexperienced long-haul pilots through complex procedures.

In late 2009, Dieter Spiess gen. Bongard took over the project, transforming those analog sketches into a digital charting system. With the help of Oliver and visualization expert Paul, they built a robust database, with focus on enhanced visualisation, colouring and readability of the tables.

Planningcharts were transferred to APOLLODOR GmbH which was founded for this purpose. From now on the charts were generated automatically every 24 hours. We take pride in the unique, patented airport symbol, which contains condensed information in just one symbol.

In 2024, Apollodor Aviation GmbH officially acquired PlanningCharts. Uli Schultz assumed leadership to ensure Dieter’s legacy continued with the same precision and dedication to pilot usability.

As we are partnering with Lufthansa Systems Lido Sky Data we are now able to display even more reliable and EASA certified data on our charts. Updates in accordance with the AIRAC cycle and daily NOTAM updates are now as accurate and reliable as possible. This collaboration marked a major step forward in our journey to create the most helpful avation charts for pilots.

Today, PlanningCharts supports pilots around the world with one connected platform for official charts, live weather, NOTAMs, airport intelligence, and pilot know-how. We continue to evolve the platform to make flight preparation faster, clearer, and more connected for every journey.


Your charts were the best and I always found them very useful on all my flights.
The charts are incredibly well-designed, delivering exactly the information professional pilots need at a glance. With their clear layout and operational focus, they make flight preparation faster, easier, and more reliable.
I have been using these charts on and off since Gerd Puppel started posting them. I now mainly use them during route training or heavy crew rotation for an improved situational awareness. I have taken a year's subscription for the charts, there is a lot of potential in your project.
I've enjoyed your charts for many years for free. Happy to provide some compensation for the demanding work and valuable tools.
I‘m currently flying in the middle east and I just got the chance to use one of your charts (provided by a colleague and costumer of yours) on a flight to Auckland! The chart helped us a lot with the HF frequencies down there in Brisbane and Melbourne! I loved the presentation, the information and how often you updated!
I downloaded your charts yesterday before my LAX-LHR sector and I have to say that I found them a great tool for improving situational awareness, with the information presented in a simple to interpret format. They are a bit like our old paper flight progress charts but with the bonus of being updated daily and with the NAT tracks overlaid. I found myself referring to your charts more often than to the official enroute map.
Beautifully simplified charts with all the essentials — no distractions, just pure usability. Ideal for efficient planning of my north atlantic flights. You made my NAT crossing so easy.